ESG Data
Environment Data and Analysis
LMS Compliance Ltd has invested the necessary management resources in ESG activities. For instance, the investments in environmental protection and safety-related facilities.
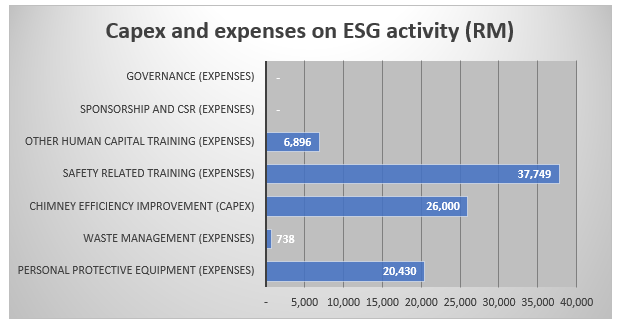
Note: Governance expenses refer to IA and INED-related fees
CO2 Emission
Greenhouse gas emissions are categorised into three scopes by the most widely-used international accounting tool, namely the Greenhouse Gas (GHG) Protocol. First, scope 1 GHG covers direct emissions from our owned and controlled sources. Second, scope 2 covers indirect emissions from the generation of purchases, such as the electricity, water, cooling, and steam consumed by us. Third, scope 3 includes all other indirect emissions in our value chain.
Discussion of Scope 1 Emissions
Using the speciality gases, namely argon, hydrogen, oxygen, and nitrogen, is a prerequisite for operating analytical instruments such as GC, GCMS, AAS, ICP, ICPMS, and LCMSMS. The manufacturer has specifically recommended gas usage in terms of volume and flow rate to achieve the desired condition and intended result. Hence, modifying the gases is almost impossible and could raise safety concern. Nevertheless, our short-term strategy to manage the scope 1 emissions is to consolidate the run time of analytical instruments, which could reduce the emissions during the conditioning of the instruments. Likewise, our long-term strategy to control the scope 1 emissions is to adopt and invest in an instrument with a smaller carbon footprint whenever the technology is available. Our emission reduction target is 5% by 2030. However, our group requires more data to conclude the performance trend analysis against the targets.
tons CO2 equivalent
| Scope 1 emissions | 2021 |
|---|---|
| Acetylene gas | 0.093 |
| Argon gas | 10.182 |
| Hydrogen gas | 0.229 |
| Nitrogen gas | 2.228 |
| Oxygen gas | 0.057 |
| Zero air | 0.004 |
| Natural gas | 1.108 |
| Petrol for generator set | 0.136 |
Note: All gases are cited from the “Emission estimation technique manual for non-petroleum industrial gases” published by the National Pollutant Inventory in December 1999, where all gases were assumed to have a similar emission to natural gas. And the factor of natural gas was cited from https://www.winnipeg.ca/finance/findata/matmgt/documents/2012/682-2012/682-2012_Appendix_H-WSTP_South_End_Plant_Process_Selection_Report/Appendix%207.pdf
tons CO2 equivalent
| Scope 2 emissions | 2021 |
|---|---|
| Electricity | 101.386 |
| Water | 2.237 |
Note: The factors were cited from https://www.winnipeg.ca/finance/findata/matmgt/documents/2012/682-2012/682-2012_Appendix_H-WSTP_South_End_Plant_Process_Selection_Report/Appendix%207.pdf
tons CO2 equivalent
| Scope 3 emissions | 2021 |
|---|---|
| Goods receiving | 42.839 |
| Business travelling by air | 2.100 |
| Business travelling by land | 0.361 |
| Sample collection and client visitation | 45.354 |
| Field sampling | 32.072 |
| Sample sent by hand and post | 9.071 |
Note: The factors were cited from https://www.winnipeg.ca/finance/findata/matmgt/documents/2012/682-2012/682-2012_Appendix_H-WSTP_South_End_Plant_Process_Selection_Report/Appendix%207.pdf Also assume sample sent by hand and post is 20% of sample collection. Goods receiving were calculated based on 30km per vendor’s invoice.
Water Usage and Sources
(m 3)
| Sources | 2021 |
|---|---|
| Government water | 6,991 |
| Rain harvesting water | 0.000 |
| Recycle water | 0.000 |
| Total | 6,991 |
Electricity Usage and Sources
(KwH)
| Sources | 2021 |
|---|---|
| Government electricity | 533,610 |
| Solar panel | 0.000 |
| Total | 533,610 |
Note: Solar panel was installed and commenced in 2022.
Hazardous Waste
(Kg)
| Waste | 2021 |
|---|---|
| Generation | 12 |
| On-site reused | 0.000 |
| Send for recycling | 12 |
Social Data and Analysis
Social factors to consider in sustainable investing include our strengths and weaknesses in dealing with social trends, talent pool, and talent engagement. We believe a focus on talent transformation can increase profits and corporate responsibility. Our employees remained stable in 2020 and 2021. Likewise, the presence of female leadership remained strong and saw an uptrend movement. Furthermore, the working hours and overtime remained stable as we encouraged the work-life balance lifestyle. The employees’ engagement remained encouraging as all scores were improved average of 1-2 points in 2021 compared to 2020. Several social factors can affect a company’s financial performance, ranging from short- to long-term challenges, as demonstrated below table:
| 2020 | 2021 | |||||||||||||||||||||||||||||||||||||||||||||||||
|---|---|---|---|---|---|---|---|---|---|---|---|---|---|---|---|---|---|---|---|---|---|---|---|---|---|---|---|---|---|---|---|---|---|---|---|---|---|---|---|---|---|---|---|---|---|---|---|---|---|---|
| Number of employees | 102 | 112 | ||||||||||||||||||||||||||||||||||||||||||||||||
| Number of employees with disabilities | 0 | 0 | ||||||||||||||||||||||||||||||||||||||||||||||||
| Percentage of employees with tertiary education | 87.3 | 91.1 | ||||||||||||||||||||||||||||||||||||||||||||||||
| Number of foreign employees | 0 | 0 | ||||||||||||||||||||||||||||||||||||||||||||||||
| Number of female managers | 6 | 7 | ||||||||||||||||||||||||||||||||||||||||||||||||
| Percentage of female managers | 40.0 | 41.2 | ||||||||||||||||||||||||||||||||||||||||||||||||
| Percentage of top 30 female employees | 53.3 | 53.3 | ||||||||||||||||||||||||||||||||||||||||||||||||
| Percentage of female C-suite members | 25.0 | 25.0 | ||||||||||||||||||||||||||||||||||||||||||||||||
| Total work days | 253 | 247 | ||||||||||||||||||||||||||||||||||||||||||||||||
| Total working hours | 2,108 | 2,058 | ||||||||||||||||||||||||||||||||||||||||||||||||
| Total overtime hours | 1,214 | 254 | ||||||||||||||||||||||||||||||||||||||||||||||||
| Total lateness hours | 505 | 380 | ||||||||||||||||||||||||||||||||||||||||||||||||
| Total medical leave taken | 292 | 281 | ||||||||||||||||||||||||||||||||||||||||||||||||
| Average paid leave taken | 17.1 | 11.2 | ||||||||||||||||||||||||||||||||||||||||||||||||
| Total training hours | 91.5 | 758 | ||||||||||||||||||||||||||||||||||||||||||||||||
| Annual training cost | 53,932 | 44,645 | ||||||||||||||||||||||||||||||||||||||||||||||||
| Number of appraisals (time) | 1 | 4 | ||||||||||||||||||||||||||||||||||||||||||||||||
| Number of performance bonuses issued | 1 | 7 | ||||||||||||||||||||||||||||||||||||||||||||||||
| Average amoeba achievement |
|
|
||||||||||||||||||||||||||||||||||||||||||||||||
| Employee engagement score | 0.0 | 7.9 | ||||||||||||||||||||||||||||||||||||||||||||||||
| Relationship with manager score | 0.0 | 8.0 | ||||||||||||||||||||||||||||||||||||||||||||||||
| Wellness and Happiness score | 0.0 | 7.7 | ||||||||||||||||||||||||||||||||||||||||||||||||
| Embassidoship score | 0.0 | 8.3 | ||||||||||||||||||||||||||||||||||||||||||||||||
| Total Recordable Incident Rate (TRIR) | 0.9 | 0 | ||||||||||||||||||||||||||||||||||||||||||||||||
| Fatality | 0 | 0 |
Discussion of Social Data
Moving forward, we are exploring the possibility of an alternative four-day work schedule. Also, we continue to adopt a work-from-home policy for supporting personnel to minimise Covid-19 transmission. Amoeba Management System continues as the talent transformation program to prepare the top 30 talents for our global expansion plan. Furthermore, we encourage talent to pursue further education, such as the Master in Business Administration (MBA) and Computer Engineering programmes, where they will be fully sponsored. Our dividend policy of 20% profit after tax will be distributed from 2021 to 2023.
Discussion of Employee Safety and Health Risk
There was one external incident reported in 2021. However, no fatality was observed. Chemical Health Risk Assessment, Local Exhaust Ventilation, and Chemical Exposure Monitoring were conducted to assess, monitor, and reduce employees’ exposure to long-term health risks. All recommendations were implemented and closed. Moreover, Chemical Exposure Monitoring on all five chemicals hazardous to health was not exceeded the permissible limit. None of the abovementioned chemicals was classified under USECHH regulation schedule 2.
Governance Data and Analysis
We believe that there is no thriving ‘Environment’ and ‘Social’ without a good governing of ‘G’ in ESG. Seem environmental and social factors may have been in the limelight recently. Nevertheless, the corporate governance, the G remains the critical ingredient to success. The below table manifests our board independence in three different aspects. First, all committees are chaired by an Independent Non-Executive Director and are led by Independent Chairman. Second, our Executive Directors do not have a duality role on the board, and their role is a board member. Third, the board independence ratio is 71.4%, board gender diversity stood at 42.9%, and board ethnic diversity was reported as 57.1%.
| 2020 4 | 2021 5 | |
|---|---|---|
| Total directors | 6 | 7 |
| Total independent directors | 0 | 5 |
| Total foreign directors | 0 | 2 |
| Board independence | 33.3 | 71.4 |
| Board diversity (Ethnicity) | 0.0 | 57.1 |
| Independent chairman1 | 0 | 1 |
| Independent audit committee1 | 0 | 1 |
| Independent nomination committee1 | 0 | 1 |
| Independent remuneration committee1 | 0 | 1 |
| Duality1 | 0 | 0 |
| Board meeting (time) | 4 | 4 |
| Board tenure (years) | 15.0 | 16.0 |
| Board experience (years) | 16.0 | 18.3 |
| Percentage of directors with doctorate education | 0.0 | 42.9 |
| Percentage of women directors | 33.3 | 42.9 |
| Training on corporate governance2 | 0 | 5 |
| Review business risk and stress testing3 | 0 | 1 |
| Review the supply-chain management3 | 0 | 1 |
| Review tax strategy3 | 0 | 0 |
| Review materiality score on value creation activity3 | 0 | 1 |
| Review public influence investment3 | 0 | 0 |
| Review impact measurement and valuation3 | 0 | 0 |
| Number of audits by regulators | 8 | 3 |
| Number of audits by other stakeholders | 5 | 2 |
Note 1: Independent directors chair all committees and are led by the independent chairman. Hence, no duality is found in our board, especially the executive directors.
Note 2: Corporate governance training includes but is not limited to policies on business conduct, antibribery, PDPA, and information security.
Note 3: This is cited from RobecoSAM’s Economic Dimension Score (EDS). https://www.spglobal.com/en/research-insights/articles/exploring-the-g-in-esg-governance-in-greater-detail-part-i 2021 refer to myco2
Note 4: 2021 governance data were extracted from MY CO2 group of companies, a predecessor before listing in SGX.
Note 5: Figures were based on the 2022 projection result.
Discussion of Corporate Governance
Having said that, governance is the key to unlock the environmental and social elements of ESG. We strive for good corporate governance by adopting RobecoSAM’s Economic Dimension Score (EDS) to measure board effectiveness. We believe profound corporate governance could contribute to firm performance, share prosperity with stakeholders, and protect and preserve the environment. Hence, our measurement of governance effectiveness is on seven areas. First, codes of business conduct, this is to address business ethics and whether the company’s code of conduct and compliance practices are designed to prevent bribery and corruption in the organisation. Second, risk and crisis management examine the effectiveness of the company’s risk management practices, including the risk management from business lines and the identification of long-term risks, impact, and mitigation efforts. Third,supply chain management is becoming more critical as we plan to expand the operation globally. Thus, the expansion above leads to licencing operations, services, and business processes. It implies that we also outsource our corporate responsibilities and reputation simultaneously. Hence, we must have strategies to manage the supply chain’s associated risks and opportunities.\ Fourth, the criteria of tax strategy examine the degree to which we have a clear policy on all taxation issues and risks associated with our tax practices. Fifth, the materiality assesses our ability to strive for long-term value creation that is relevant and sustainable for our business and publicly report these values. Sixth, the policy influence criteria evaluate the money companies allocate to create or influence public policy, legislation, and regulations to be disclosed the contributions to such entity. Seventh, Impact measurement and valuation assess whether we have business programs for social needs and whether it is in the form of expenses or investments that create societal impacts. Hence, we need to analyse the impacts that may not be included in the financial accounting but are the potential to be capitalised on.
Discussion of Personal Data Protection
Our group has a personal data protection & confidentiality policy to be acknowledged by all the stakeholders, namely employees, clients, vendors, and trainees. To ensure personal data are stored, managed, and used are all secured. We are taking the following steps to achieve this objective. First, employees and trainees must sign the PDP policy during the induction program. Second, clients are asked to acknowledge the PDP policy during the first login at our Laboratory Information Management System (LIMS). Third, vendors must sign the PDP policy during the annual vendor assessment.
Business sustainability has been defined into three broad dimensions: the planet, people, and prosperity. However, the UN further articulates sustainability in the 17 Sustainable Development Goals (SDGs), covering additional dimensions such as peace and partnership. Hence, our ESG reporting is crafted toward fulfilling and realising such goals as much as possible.
| Dimension | Measurements | SDG | 2021 | 2022 3 |
|---|---|---|---|---|
| Planet | ESG-compliant occurrence |
|
18,259 | 4,788 |
| Net-zero carbon emission | ND | ND | ||
| Solar Energy | ND | ND | ||
| Reuseable Water | ND | ND | ||
| People | ESG-compliant occurrence |
|
87,850 | 21,400 |
| Customer Satisfaction Index2 | +73% | +33% | ||
| Productivity1 | 12,639 | 12,699 | ||
| Dividend (PAT) | 0.00 | 20.0% | ||
| Supply Chain Cash Conversion (SCCC) | ||||
| T30 Women Participation | 53.3% | 53.3% | ||
| Prosperity | Profitability |

|
4,948,000 | 1,437,000 |
| Growth1 | 5.3% | 3.7% | ||
| Leverage (DE) | 46.7% | 38.6% | ||
| Stock Price | 0.00 | 0.00 | ||
| Beta | 0.00 | 0.00 |
Note 1: Figures were based on three years of CAGR between 2019-2022, calculated based on an average month.
Note 2: Calculated based on Net Promoter Score
Note 3: Figures were based on 2022 quarter one audited result.
Discussion of Sustainability on Digital Transformation
Align with our corporate philosophy as digital transformation is among the vital element. Our effort to digitalise the manual processes brought significant benefits to our group from three perspectives: planet, people, and prosperity. Furthermore, creating a sustainable competitive advantage against the rivals. In 2021 alone, our digital transformation has achieved signifcant progress. For instance, we managed to reduce 18 trees, increased efficiency from 50% to 100%, and reduced 100% misappropriation.
| Dimension | Digital Transformation | Impact | SDG | 2021 |
|---|---|---|---|---|
| Planet | Issuance of the electronic Certificate of Analysis, Invoices, Quotations, Sales Order, and Delivery Orders | Reduce printing and postage |
|
18.0 trees |
| People | Digitalise the sample collection, registration, administration, approval, client communication and confirmation processes (Aikinz-LIMS) |
Reduce human dependency
Reduce turnaround time Reduce human errors Increase productivity Increase traceability Increase talent transformation |
|
50%
80% 100% 100% 100% 50% |
| Digitalise the ISO document management system (Aizenz-DMS) | ||||
| Digitalise the Amoeba Management System (AMS) | ||||
| Digitalise the Corporate Communication System (mySuite) | ||||
| Prosperity | High security QR code on COA | Reduce misappropriation | |
100% |
| 21 CFR Part 11 e-Signature |